We’re excited about the recent update to our Navigator sustainability research platform – so excited in fact that we want to outline some of the new features and show you how subscribers can take advantage of them.
We know how quickly sustainability information is proliferating and how this makes it harder and harder to make sense of the available data. Where should you be looking? Which data points are linked to financial value? SASB is here to help. Our goal with the revised Navigator is to help clients break through the noise and confusion to find which ESG issues impact corporate performance and how well companies are disclosing on those issues.
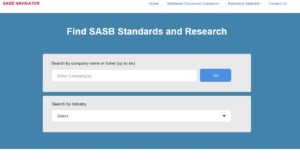
So let’s walk through an example. Let’s say your client is PG&E (PCG) and you’re helping with sustainability management and reporting, or you are an analyst researching PG&E. Your first step would be to head over to the Navigator site and input either PG&E or its ticker, PCG, into the company/ticker search field. New functionality here allows you to type either company or ticker, since we previously received feedback that people did not always remember a company’s ticker letters:
You’re taken to the SASB Standards page for PG&E, where you can research disclosure topics such as greenhouse gas emissions, air quality and water management:
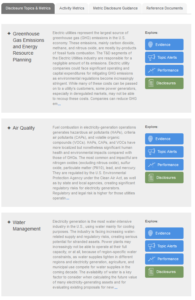
You can dig deeper on each of the above topics by clicking “Evidence” on the “Greenhouse Gas Emissions and Energy Resource Planning” section. You’re taken to a page that shows you the breadth and depth of all the possible research available through the Navigator:
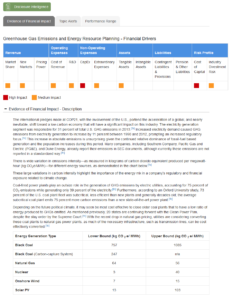
The financial drivers for any of the disclosure topics are also available via this “Evidence” tab. They appear at the top of the screen and look like this:
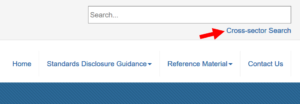
Or if you’d prefer to get a quick view of the financial drivers for all topics in PG&E’s industry, go back to the PG&E results page and click “Cross-Sector Search” next to the search bar:
From there, you will be directed to a screen where you can input your search criteria. For the Electric Utilities Industry, you would input the following:
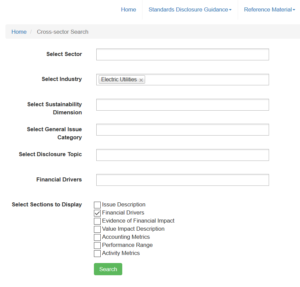
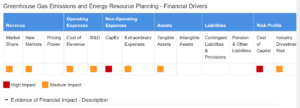
Which will take you to the following page, where you can easily see the financial drivers in the Electrical Utilities industry:

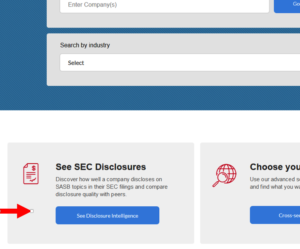
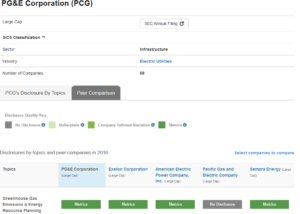
The above example helps with managing sustainability information, but what if you want to deal with reporting? For example, understanding where PG&E sits compared to peers and the quality of its disclosure? Here, you would use the Disclosure Intelligence app, accessible from the homepage:
The Disclosure Intelligence feature homepage prompts you put in a ticker, in this case we would input PCG:
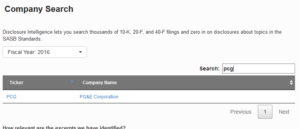
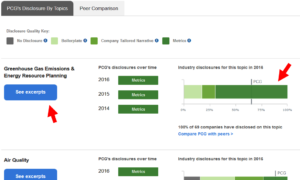
Selecting PG&E will allow you to see the company’s disclosure quality relative to its peers. You can also click on the “See excerpts” button and you will be taken to SEC disclosures that serve as the basis for the data underlying the Disclosure Intelligence feature:
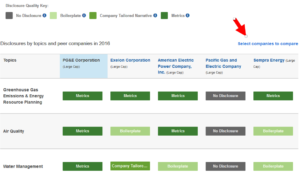
You also have the option here to do a peer comparison by pressing the “Peer Comparison” tab. There, you will see up to four other companies. You can choose which companies to compare PG&E too though, by clicking on “Select companies to compare”:
In addition to the above, you can also use this page to see industry leaders. First, click on the Industry category at the top of the page:
By clicking on the tab you will be taken to a page ranking companies in the Electric Utilities industry category by disclosure quality:
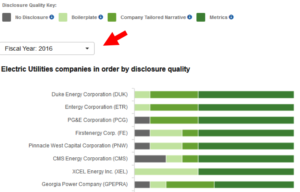
You can use the dropdown menu in the above to change the reporting year, and thus the order of the companies.